By using this site, you agree to the Privacy Policy and Terms of Use.
Accept
Think MarketingThink MarketingThink Marketing
  • Campaigns
  • Inspiration
  • Marketing
  • Management
  • More
    • Digital
    • Branding
    • Creativity
    • Case Studies
    • Productivity
    • Entrepreneurship
    • News & Trends
    • Interviews
    • Events
    • Opinions
    • Economics
  • Bookmarks
  • 🇵🇸 Stand with Palestine
Reading: Facebook Engagement Benchmark Report 2014
Share
Sign In
Notification Show More
Aa
Think MarketingThink Marketing
Aa
Search
  • Campaigns
  • Inspiration
  • Marketing
  • Management
  • More
    • Digital
    • Branding
    • Creativity
    • Case Studies
    • Productivity
    • Entrepreneurship
    • News & Trends
    • Interviews
    • Events
    • Opinions
    • Economics
  • Bookmarks
  • 🇵🇸 Stand with Palestine
Have an existing account? Sign In
Follow US
© 2022 Foxiz News Network. Ruby Design Company. All Rights Reserved.
Facebook-Engagement-Benchmark-Report

Facebook Engagement Benchmark Report 2014

Think Marketing
By Think Marketing Published September 18, 2014 Case Studies
Share
1 Min Read
SHARE

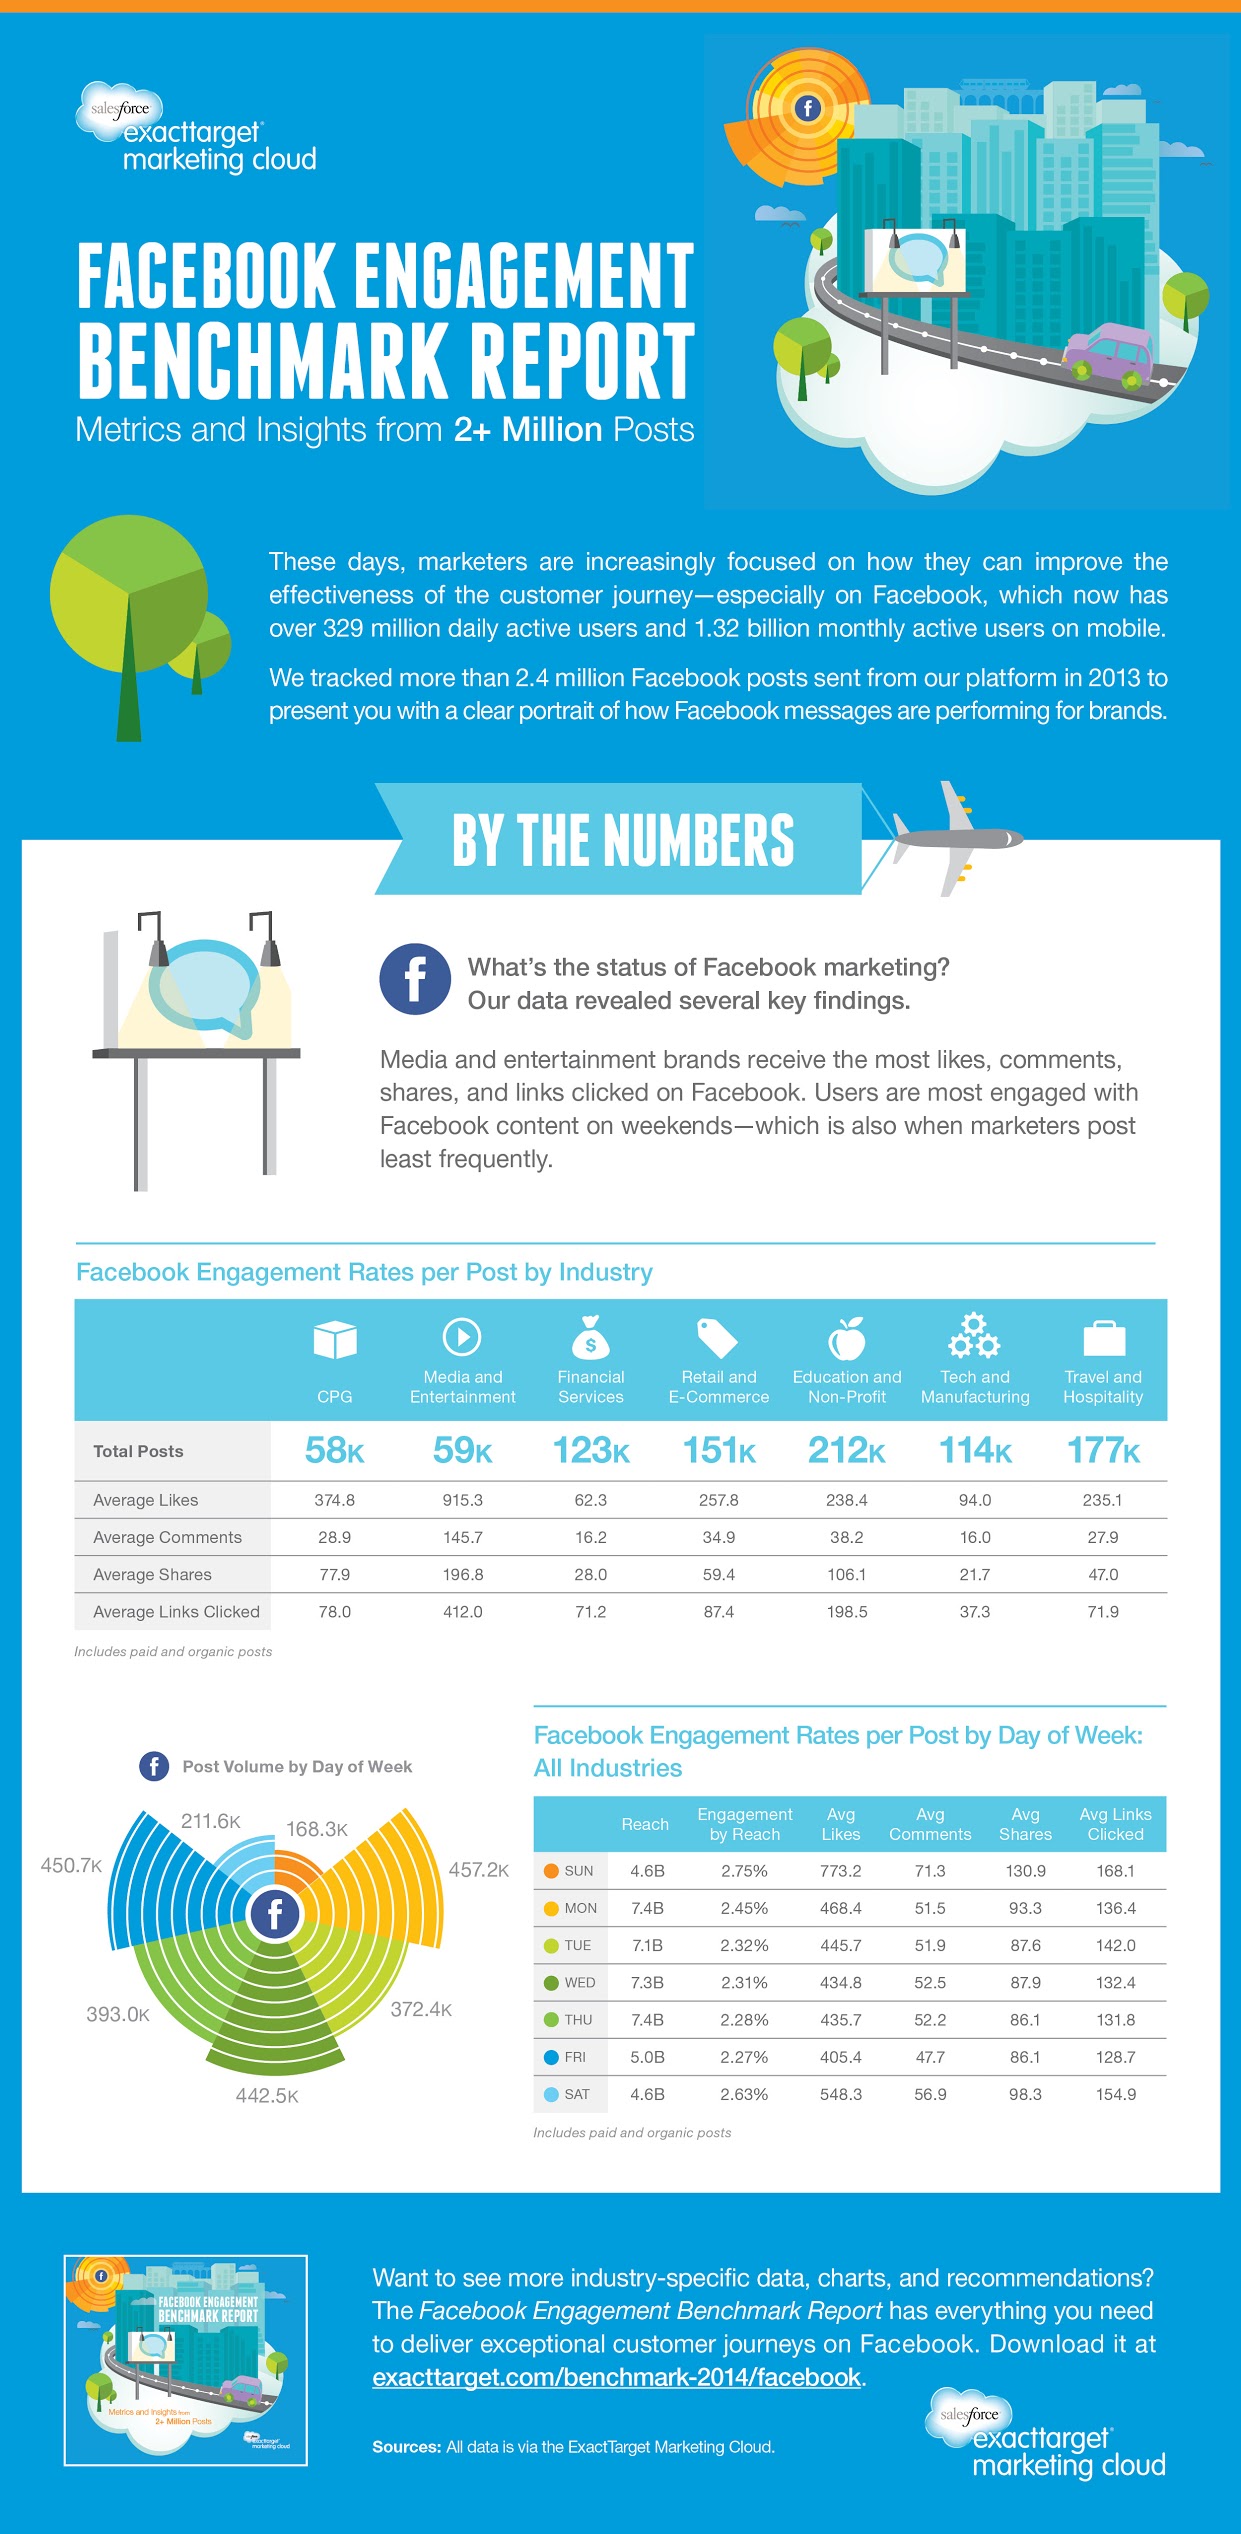
Including some very surprising truths about weekend Facebook engagement rates, Salesforce has delivered report measuring Facebook engagement rates – using a pool of 2.4 million posts. It’s interesting to note that Salesforce analyzed 59k Media and Entertainment posts, while they had 2-4x the data to work with in many other industries (212k Education and Non-Profit posts, 177k Travel and Hospitality posts, etc.). This could suggest that Media and Entertainment pages are seeing better engagement rates by posting less content.

As Marketers used to think of Weekdays with peak performance Tues. – Thurs. in the afternoons, the Facebook engagement data pulled from 2.4 million posts tells adifferent story. Sunday actually sees the most engagement by reach (2.75%), as well as the highest averages for Likes, Comments, Shares, and Links Clicked! This is likely attributed to very low reach (“low” being 4.6B, compared to 7.1B – 7.4B in the Mon. – Thurs. range).

  • Average Likes Per Post: 374.8, Consumer Packaged Goods / 238.4, Education and Non-Profit
  • Average Comments Per Post: 38.2, Education and Non-Profit / 34.9, Retail and E-Commerce
  • Average Shares Per Post: 106.1, Education and Non-Profit / 77.9, Consumer Packaged Goods
  • Average Links Clicked Per Post: 198.5, Education and Non-Profit / 87.4, Retail and E-Commerce

Check Out the Facebook Engagement Infographic Below

facebook-engagement-benchmark-2014-infographic

- Advertisement -


Think Marketing September 18, 2014
Share This Article
Facebook Twitter Whatsapp Whatsapp LinkedIn Email Copy Link Print
Share
By Think Marketing
Follow:
Knowledge Hub Specialized in Publishing Insights and Analytics Developed for Digital Marketing, Public Relations and Communications Experts.
- Advertisement -

Latest >

Is Constantly Using Jingle-Based Adverts A Sign Of Creative Stagnation?
2 Min Read
Is It Possible For AI To Replace Human Writers?
2 Min Read
10 Essential Graphic Design Tools For Beginner And Experienced Graphic Designers
3 Min Read
6 Fastest Growing Jobs in Marketing with High Demand
2 Min Read

Featured Stories >

How to Discover The Ideal Marketing Career Path for You
3 Min Read
7 Egyptian Brands That Truely Supported Palestine
2 Min Read
25 Made in Egypt Brands To Replace The Ones You’re Boycotting
3 Min Read
Follow US
© 2012- 2023 Think Marketing Magazine. MADE WITH ♡ IN CAIRO. All Rights Reserved.
  • About
  • Contribute
  • Advertise
  • Contact Us
Welcome Back!

Sign in to your account

Lost your password?